[tooling] · · 3 min read
XY: A Rust-Powered Python Charting Library That Renders 10B Points
Reflex's new open-source charting library pairs a declarative Python API with a Rust core to keep interactive rendering flat from 10K to 100M points.
By ByteBulletin Editor · Editor
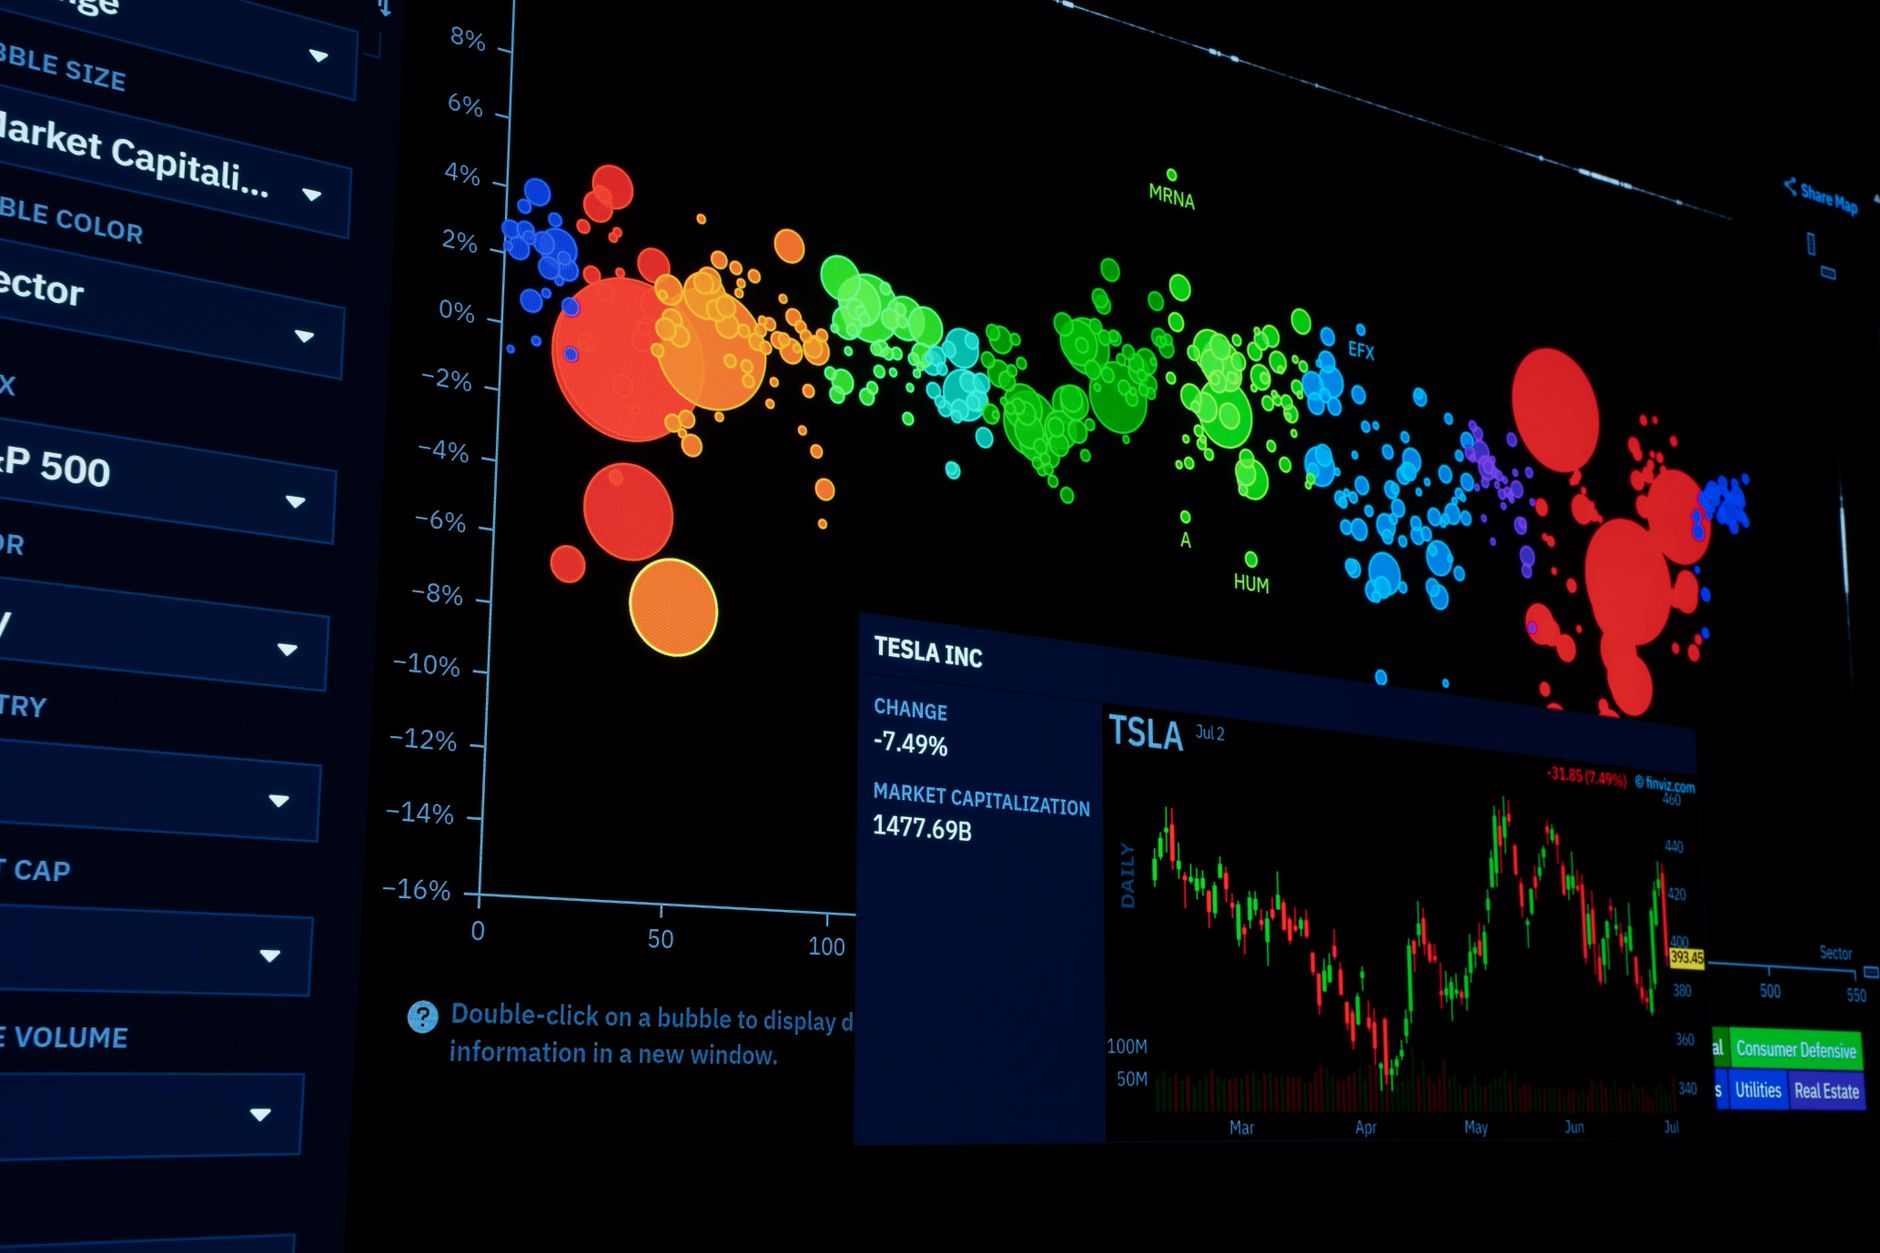
Charting in Python has long been a trade-off: Matplotlib gives you control but buckles under scale, while Plotly offers interactivity but serializes every point as JSON and pushes the work to your browser. XY, a new open-source library from the team behind the Reflex web framework, aims to break that compromise with a Rust core that computes only what the screen needs.
Announced on Hacker News, XY is an extremely fast, interactive, and customizable charting library for the web, notebooks, and static exports. It's in alpha, but the headline claim is bold: it renders the entirety of OpenStreetMap — a 10,000,000,000-point dataset — in a browser. That's not a typo.
The Architecture: Level-of-Detail in Rust
XY's secret is a columnar store (called a ColumnStore) that keeps exact values in Python, while a Rust core computes a level of detail and transfers typed binary buffers to the browser. For small charts, every point is sent; for large ones, the Rust core decides what's visible at the current resolution and sends only that. Pan, zoom, hover, and selection run the same process for the new range, and a selection returns the original rows from Python.
This "screen-bounded density surface" approach means that above 200K rows, XY draws a density surface instead of one marker per row, which flattens the performance curve across four orders of magnitude. In the project's benchmarks, XY holds 0.071 seconds at 10K points and 0.081 seconds at 100M points — nearly flat. When you disable density (drawing exact markers per row), it still renders 100M markers in 1.34 seconds on 5.26 GiB, which is impressive on its own.
The benchmarks pit XY against Matplotlib and Plotly with rigorous methodology: sentinel points are planted and verified lit, and the clock stops only when 10 byte-identical frames are captured. While you should take vendor benchmarks with a grain of salt, the results are consistent with the architectural advantages — other libraries serialize every value as JSON and ask the browser to draw everything, which is a losing game at scale.
Adoption: Matplotlib-Compatible API and Reflex Integration
XY aims to be a one-stop shop for Python users who want a flexible charting library for everything from everyday plots to custom application visuals. The API follows matplotlib conventions: change the import and keep your plotting code. A chart is a container plus the marks inside it, and any sequence works — NumPy is optional. Full customization is possible with Python, CSS, or Tailwind.
The Reflex integration is a key differentiator: any XY chart becomes a regular Reflex component with no JavaScript, iframe, or separate chart service. Hover, pan, and zoom keep working, and charts can be driven by Reflex state, events, or live streams. This positions XY as a natural fit for building data-rich web apps in pure Python.
Roadmap and Caveats
XY is in alpha and evolving fast. The current roadmap covers broad 2D coverage first, then geographic, 3D, and volume visualization. The matplotlib compatibility guide warns that not all charts and functionality are supported yet. If you need something missing, you can open an issue — the project is clearly responsive to community input.
For developers evaluating charting libraries, XY is worth a look if you're hitting scale limits with Plotly or want a single library that works across notebooks, export to HTML/PNG/SVG/PDF, and web apps. It's also a compelling example of how Rust can be used to push Python libraries to the next level, and the open-source community will be watching closely.
Get the signal, not the noise.
One short email when it matters. No recaps of recaps.
SHARE
RELATED

[tooling] ·
Cua releases open-source computer-use agent stack and CUA-S1 models

[tooling] ·
MaskShift Launches: A Zero-Dependency, Model-Agnostic Coding Harness for the Terminal
[tooling] ·
Agentic Ship: An Open-Source Toolkit to Replace Hosted AI Builders

[tooling] ·
Goose Accelerates Release Cadence with v1.47 and v1.49 Updates

[research] ·
AI Pioneers Debate Open Weights: Hinton, Li, and Ng Make the Case for Staying Open

[tooling] ·